Restaurant Reports and KPIs: Owner Dashboard and Daily Manager Checklist
A practical guide to restaurant KPIs, owner dashboards and the manager's daily routine for turning sales and operational data into action.
- Bahram Davoodi

A useful restaurant report is not a collection of numbers. It should lead to a decision: what sold, when demand peaked, which tables stayed occupied longest, where kitchen time increased, what stock moved and why a shift showed a cash difference. A clear KPI framework connects sales and operational data so managers can act rather than simply observe.
Sales reporting
Sales should be reviewable by day, hour, product, category, location and channel. Revenue alone is incomplete; compare it with transaction count, average order value, discounts, refunds and the mix of dine-in, takeaway and online orders. Use comparable periods and note holidays or local events before interpreting change.
Sales per table and guest
Total sales do not explain dining-room productivity. Sales per table, sales per guest, covers, average table time and turnover by service period give better context. A higher table value may come from larger parties or longer occupancy, so revenue and time should be viewed together.
Product and category reports
The best-selling item is not always the most profitable. Review units sold, revenue, discounts, voids, refunds and an approximate contribution margin side by side. Reliable margin analysis also requires accurate purchase prices, recipe or usage data and cost allocation; a POS report alone should not be treated as final accounting profit.
Kitchen reporting
Average preparation time, delayed tickets, amendments, cancellations and workload by station show where the real bottleneck sits. Compare similar service periods and separate kitchen preparation from waiting for collection or packaging. These measures can guide staffing, station layout, menu design and training.
Reservation and capacity reporting
- Number of reservations, parties and expected guests
- Arrival, cancellation and no-show rates
- Average table occupancy time
- Unused capacity during peak periods
- Walk-ins, waiting time and declined demand
Capacity reporting is most useful when linked to table size, service area and time slot. A full reservation book can still leave unusable gaps if party sizes and table combinations are poorly matched.
Payment and shift reports
Cash, card, mixed payments, tips, refunds, deposits and cash differences should be visible by shift and user. The report should distinguish recorded revenue from tender movement and from amounts still open or unsettled. This supports daily reconciliation and makes exceptions easier to investigate.
Inventory and purchasing reports
Current stock, items below minimum, waste, stock adjustments, incomplete deliveries and purchase-price trends help managers act before a product becomes unavailable. Variances need context: sales, recipes, units, transfers, waste and count quality all affect the result.
Discount, void and refund reports
Count and value should be linked to user, reason, order and time. An unusual increase may indicate training problems, unclear permissions, menu errors or weak internal control. The purpose is not to accuse staff automatically, but to make review consistent and evidence-based.
Multi-location reporting
Locations should be compared with relative measures such as sales per opening hour, table, transaction, guest or labour hour. Comparing only total revenue can be misleading when capacity, opening hours, format and local demand differ.
Owner dashboard versus operational dashboard
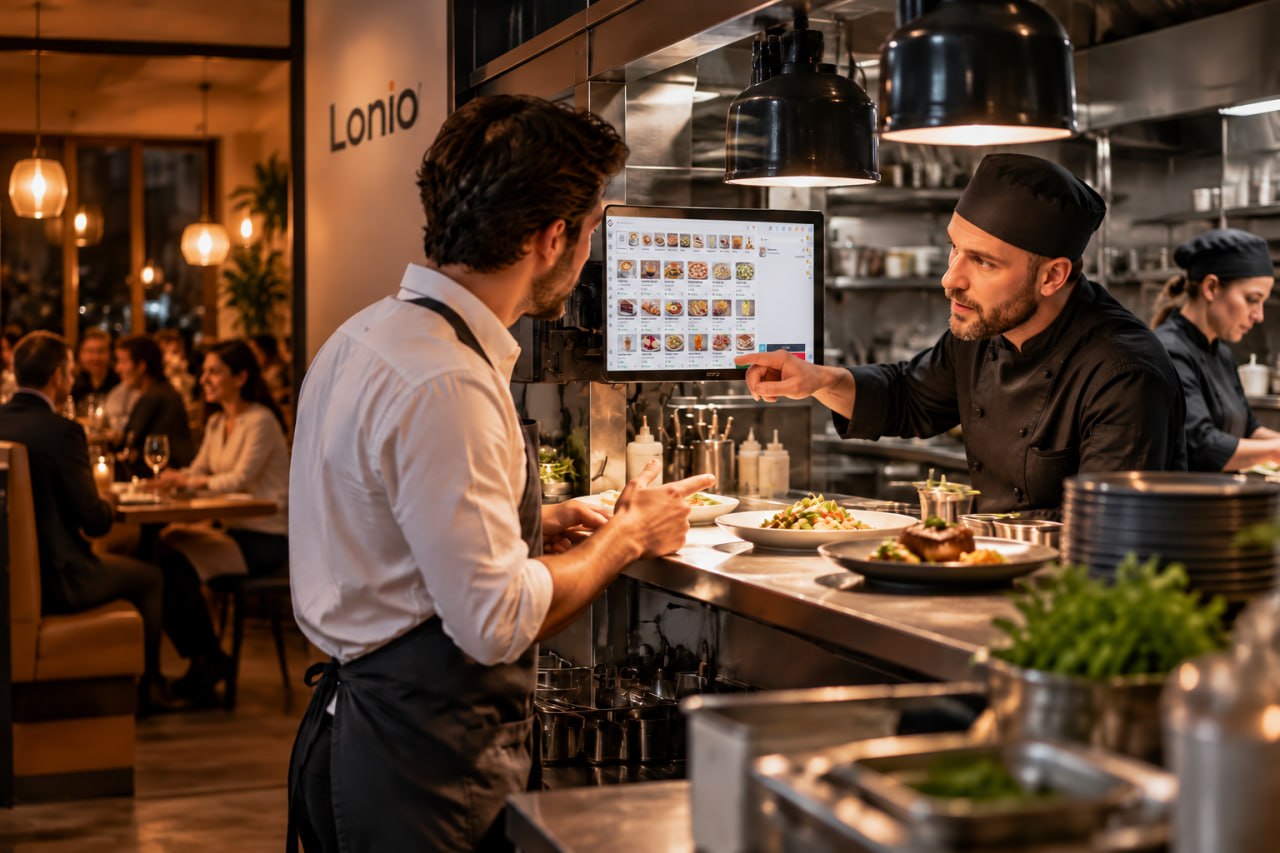
A shift manager needs open orders, delayed tables, kitchen queues, payment issues and immediate alerts. An owner or regional manager is more likely to focus on sales trends, approximate profitability, location performance, waste, refunds and purchase-cost changes. Combining every need into one crowded screen reduces clarity.
The owner's first view should contain a limited set of decision-driving KPIs with drill-down to location, date, product, order or user. Definitions must remain consistent: net sales, average order value and guest count should not be calculated differently across reports.
Daily restaurant management routine
Before service
- Review reservations, large parties, blocked capacity and expected demand.
- Confirm staffing, section responsibility and absences.
- Check POS, payment terminals, printers and kitchen routing.
- Review unavailable items, menu changes and expected deliveries.
During service
Watch waiting times, delayed tables, kitchen status, cancellations, discounts and problem payments. The manager's role is to identify exceptions and bottlenecks, not to interfere with every order.
At shift end
- Reconcile payment methods and cash differences.
- Review open, incomplete or partly paid orders.
- Check unusual discounts, voids and refunds.
- Record faults, complaints and unfinished work for the next responsible person.
Daily manager dashboard
- Today's sales versus a comparable day
- Order count and average basket
- Payment-method mix
- Open and delayed orders
- Upcoming reservations and dining-room capacity
- Low-stock products
- Shift differences and operational alerts
Practical scenario
Saturday sales are higher than the previous week, but average order value is lower and kitchen time has increased. Category and channel analysis shows more small takeaway orders and a packaging-station bottleneck. The appropriate action is to increase capacity at that station, not redesign the entire menu.
Actionable alerts and thresholds
An alert is useful only when the threshold, owner and next action are defined. Examples include an unusual rise in refunds, preparation time above the restaurant's normal range, stock below minimum or growing cash variance. Thresholds should reflect the restaurant's own history and service model rather than a universal number.
How to avoid the wrong conclusion
Compare similar periods, consider holidays, weather and events, and do not interpret a KPI without operational context. Missing guest counts, incorrect payment methods, inconsistent void reasons or late stock entries can distort the result. Reports should be reviewed together with data-quality checks.
How Lonio can help
Lonio reporting can bring sales and operational data into a structured management view. The restaurant and café solution shows how data can originate from reservations, tables, POS, kitchen and inventory. Exact metrics, drill-downs and alerts should be confirmed against the production configuration.
Conclusion
The best dashboard is not the one with the most charts. It is the one that helps the manager choose the next action. Sales, tables, kitchen, payments, inventory, reservations and shifts should be interpreted as one connected operating picture.
Frequently asked questions
What should a restaurant's daily report include?
Sales, order count, average basket, payment mix, open orders, kitchen timing, upcoming reservations and shift differences should be viewed together.
How does an owner dashboard differ from a shift dashboard?
The owner focuses on trends and location comparison, while the shift manager needs immediate exceptions and actions.
How can locations be compared fairly?
Use relative KPIs such as sales per opening hour, table, transaction, guest or labour hour.
When is a dashboard alert useful?
When its threshold, responsible person and next action are clearly defined.